June 2023 Market Update
Is What's Happened Really Possible
This month we did something not even I thought was possible...
Ok, the election is over – it’s basically the status quo – and Albertans are back to business. But do you remember me asking you last month if the election would re-direct the attention of Albertans away from their real estate? Well, time was going to be the only thing that provided that answer, and now
we have it. Not a fricken chance! It was actually the opposite.
May 2023 goes down as the highest-selling May of all time in Calgary!
Yup, even higher than last year, which had shattered all prior records.
This even surprised me, who – if you’ve followed our updates – is a major advocate for the power of our market based on all the fundamental data we’ve seen emerge all year long.
Let me add some context to why this shocked even me…
January had 40% fewer sales than January 2022. February had 47% fewer sales than the previous year. March had 40% fewer sales. April had 20% fewer sales…
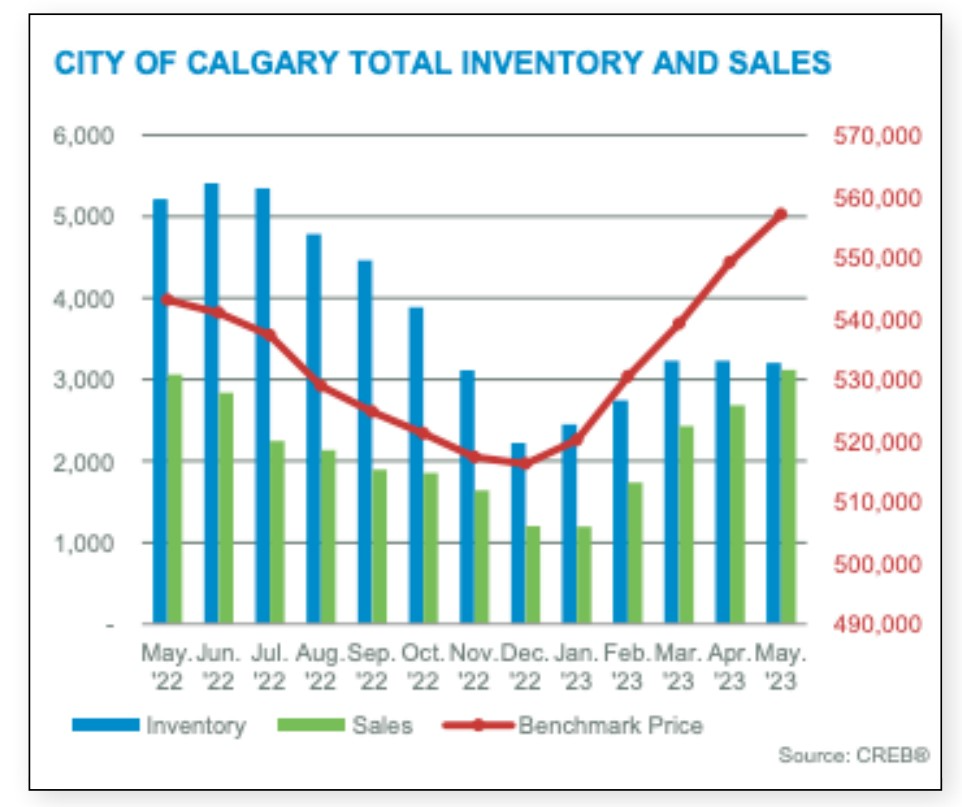
And then, seemingly out of nowhere, May comes in with 2% more!
This continues to show the momentum and the continuing strength of buyer demand in the Greater Calgary area.
On this graph, you can see how it’s been in comparison to recent years. This block of 3 big years in a row towers over most of the last decade and should give us all massive confidence in our real estate market.
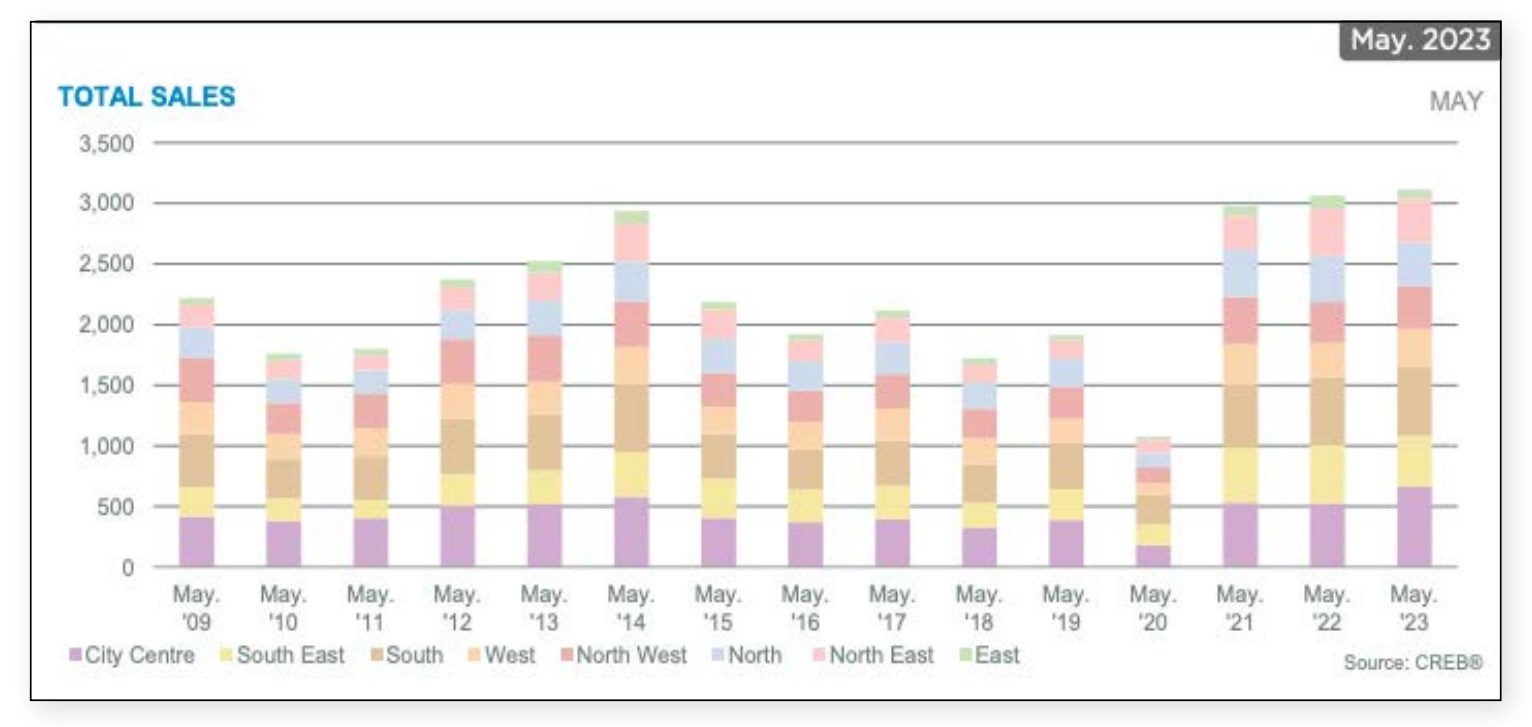
This is a 100-home per Day pace, vs. a 90-sale-a-day pace in April & an 80 sale-a-day pace in March.
Now, as always, this is an ‘overall picture.’ When we drill down further, you see more of the 2023 story appear, which is that our apartment sales are still driving the majority of our increased demand and buyer activity.
Apartments sold 36% more than they did last year at the same time and are the real ‘master puppeteer’ of our show.
Detached & Row Homes are selling about 10% less, and Semi’s about 5% more than at this time in 2022.
Okay, with the Sales Summary behind us, let’s check whether we finally started to see more properties come to the market for us to choose from and handle all this demand…
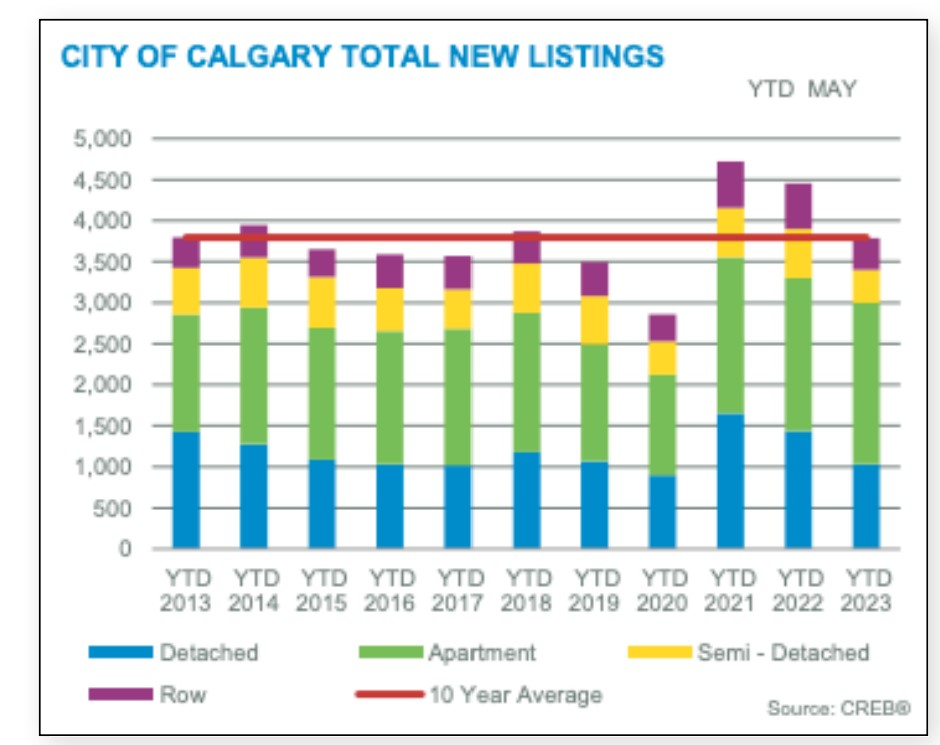
This graph shows the year-to-date (YTD) ‘new listings’ figures to the end of May. If you look at the bar on the far right, representing YTD 2023, it’s pretty much equal to the 10-year average. So, at first glance, this would lead us to believe new listings aren’t a problem. Sure, not as high as the last two years, but no ‘slouch’ either.
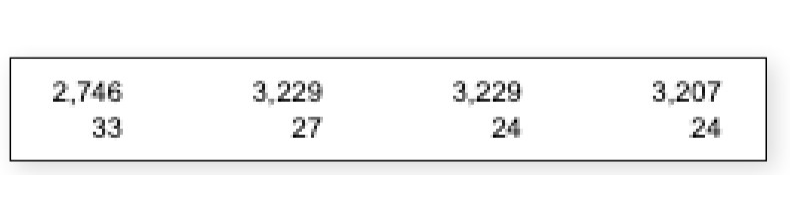
We started the month with 3,229 homes on the market (a drop off of 34% from last year) and ended the month with 3,207. So, 20 fewer homes are on the market (now a 39% drop from the previous year).
This means that we continue to ‘net out’ in the opposite direction of what the market really needs to handle all the buyer demand.
Last year from April to May, despite the crazy we had, we still saw 400 more available homes accumulate on the market. This year it’s ‘zilch.’ This graph really shows the inventory trend better than any words can...
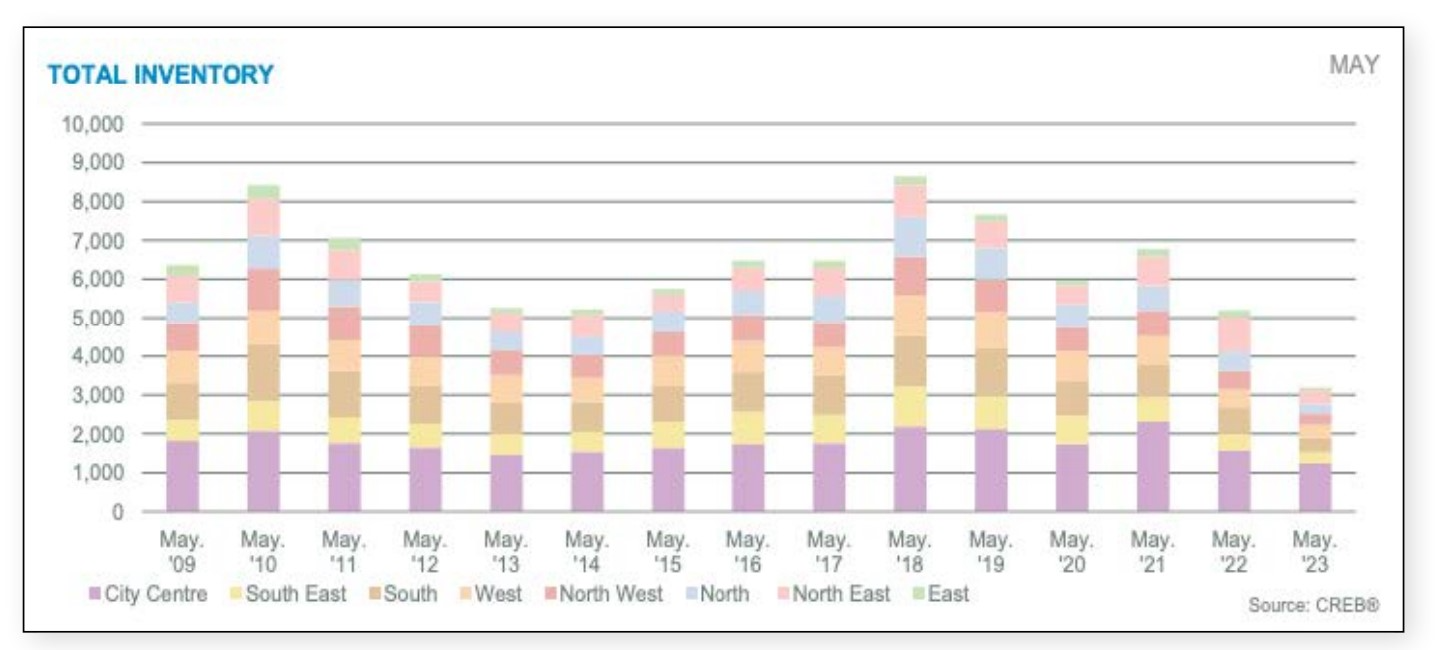
Last year from April to May, despite the crazy we had, we still saw 400 more available homes accumulate on the market. This year it’s ‘zilch.’ This graph shows the inventory trend better than any words can...
Zooming in a little further into the property types...
Detached homes month-over-month saw zero net gain in inventory, Semi-Detached saw nearly a 20% drop, Row Homes were flat, and Apartments also flat.
In every housing segment, we see this occur, not just what seems to be our hottest part of the market – our Apartments.
So, we’ve talked Sales and Inventory… now let’s talk about Pricing. Everyone wants to know:
“Is my home price going up or is it going down?” so they can either be aware of how one of their life’s most significant assets is doing or make an educated decision about entering the market.
Looking at this graph (The first one below), point your eyes to the red line – our Benchmark Price. What you are seeing is that pricing continues to trend up and up and up. This graph shows how long we’ve been trending up now and where we have come from. Okay, let’s zoom into this year’s price graph now (The second one below).
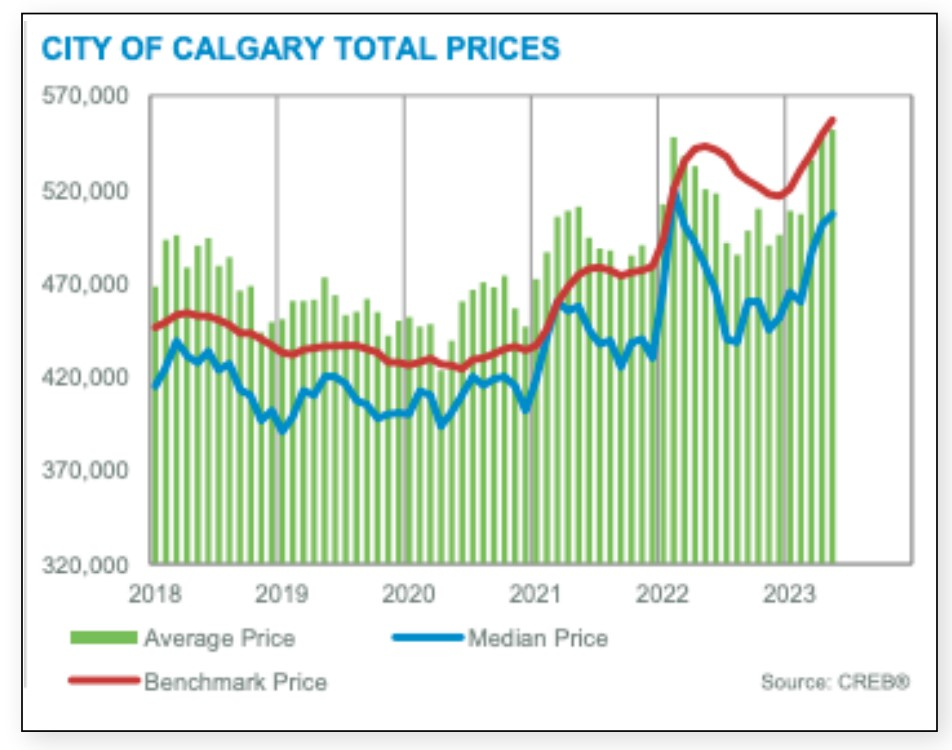
You’ll notice very quickly that on this month-over-month graph, the red line is almost linear – which means that it is steadily increasing without much of an adjustment or even a slowing trend.
As of the end of this May, we once again hit an all-time high in our city’s housing price points!
Detached homes are now at $674k.
Semi’s are at $600k.
Row Homes are just under $400k at $390k.
And Apartments are just shy of $300k.
All new highs in all property types!
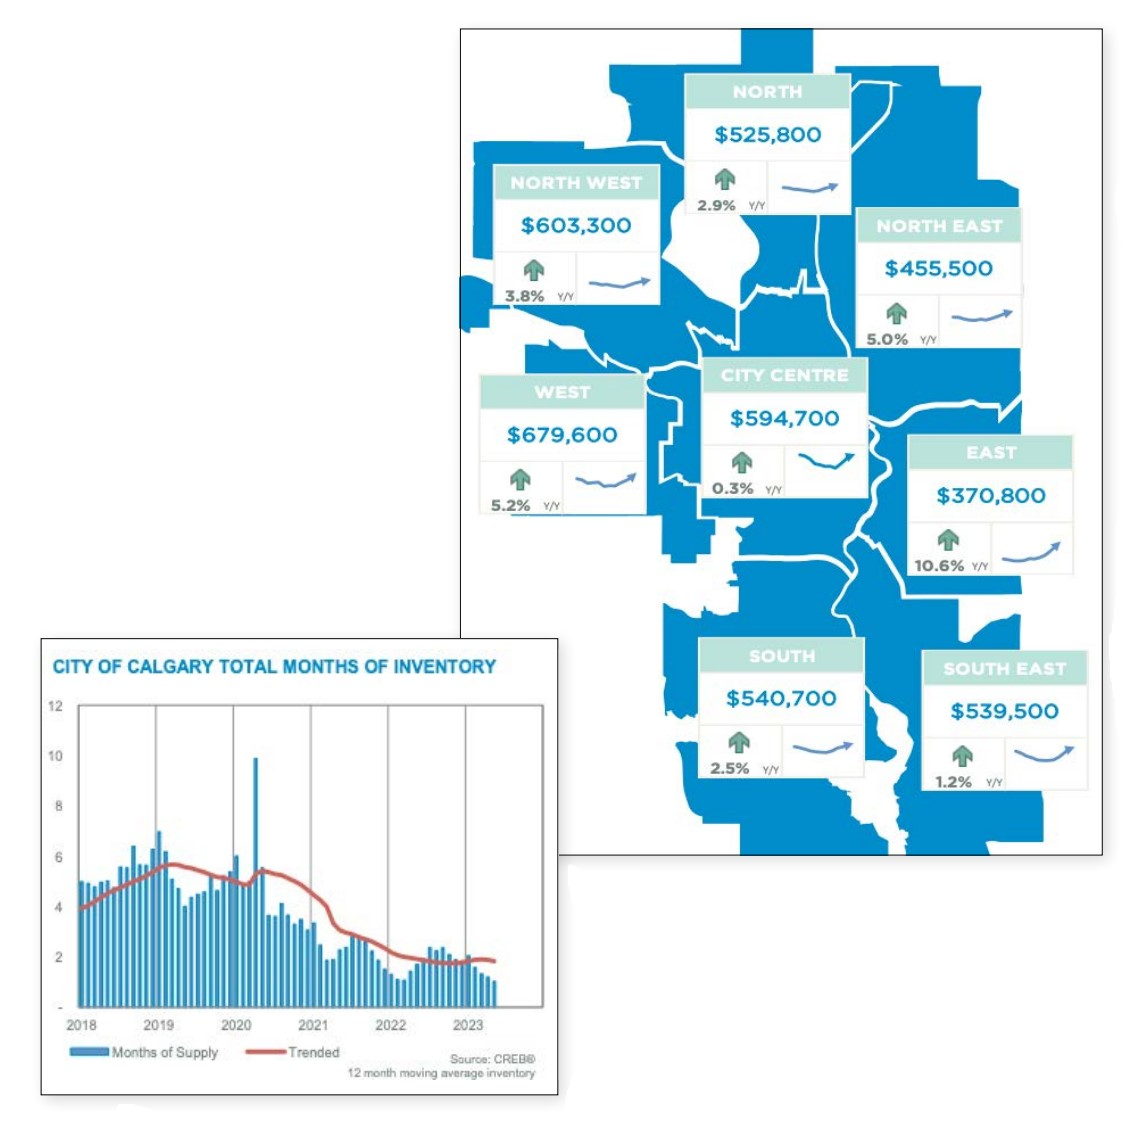
And it’s all new highs in all districts, too! Check this out (the graph is below)...
But really... how can this be? And isn’t the ‘other shoe’ going to drop(because that’s what you were told would happen, right?)
Well, it’s not going to happen, and it basically can’t happen. Aside from a war breaking out, or a ‘Great Depression level crash of sorts… this current momentum and sales value climb was not built overnight. It’s not a fad, trend, or a kneejerk feel-good moment for sellers.
This result has been built over a decade, nested in proper economic fundamentals, as I’ve been talking about all these years.
But really... how can this be? And isn’t the ‘other shoe’ going to drop (because that’s what you were told would happen, right?)
Well, it’s not going to happen, and it basically can’t happen. Aside from a war breaking out, or a ‘Great Depression level crash of sorts… this current momentum and sales value climb was not built overnight. It’s not a fad, trend, or a kneejerk feel-good moment for sellers.
This result has been built over a decade, nested in proper economic fundamentals, as I’ve been talking about all these years.
Check this graph out (just above). This is the ‘Months of Supply’ graph that combines the total inventory of homes on the market & our current buyer demand…
The lower the graph is, the faster the market. The lower the chart, the more demand outweighs supply.
This graph gives us a powerful indicator of where we sit, and when we look at it – not every month, but how we continue to perform over several years – you see that it has taken us a long time to get to this point.
So, any commentary that we might ‘adjust out’ of this market soon or that this run is close to over would simply be ‘headline rhetoric’ looking to catch eyeballs.
If we didn’t put another home on the market in June, we’d have zero homes left to buy by the end of the month! That sort of supply & demand equation does one thing – pushes pricing up & up & up.
This situation is rooted in fundamentals, not emotion or hype. It’s simply real people, real profits, real money, home by home, coming here to put down roots or invest for the future.
This is precisely what we want, and can be confident about, to plan our future, especially regarding our housing.
Often, when we talk ‘Months of Supply,’ we also bring up ‘Days on Market.’
You might be thinking, “You’ve convinced me I can sell for what I want, or maybe even more. But how fast can we get this done?”
Well, this is the last 4 months of sales, over top of the ‘days on market’ stat…
It was frustrating if you were considering a purchase or a move last year at this same time of the year. Buyers were stuck in multiple offers, and people paid a bit more than they wanted in order to get their homes, but people also gave up and sat on the sidelines awaiting a correction or a crash…
But... that didn’t happen. That doesn’t happen ever when you look over more than a 2-3 year timeline (it is near impossible to find that in our history).
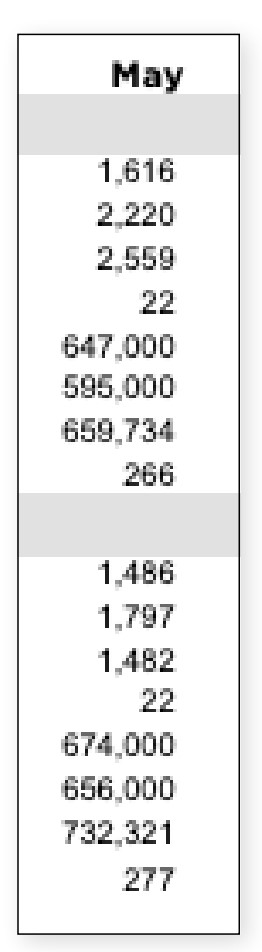
Look at this sliver (left) from the Detached homes chart. Last year, when you were fed up and giving up when it was too expensive, and it was the market nobody thought we could beat…
The price then was $647k. Now it’s $674k.
Then there’s Apartments – was $269k, and now it’s $299k!
Then we had Row Homes – was $359k, now $390k.
And finally, Semi-detached was $581k in May 2022 and is now $600k.
No matter how you shake it, making your move is better – despite the
intensity – than simply trying to wait.
We don’t know exactly what’s coming, but we do know real estate is a long game that, in the end, always wins. The pain to get in, I believe, is always easier than the pain of losing out on the future upside (as we just showed).
And guess what? Historically, the gain we just had as a city is under the 40-year average. Yes, a city-wide gain of 2.6% year-over-year is way below the norm.
So, speaking from my industry experience, I’m shouting out to you with the actual market data,
‘Get more assets in the market and let time do its thing’.
Enjoy the month, and we do this again in July.
Recent Posts